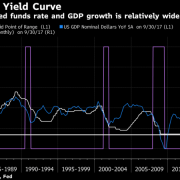
The Economic Yield Curve Is the One to Watch
From: Bloomberg / Joseph Carson / 21 de noviembre
The difference between the federal funds rate and economic growth is unusually wide, consistent with a positive outlook. The rapid flattening of the U.S. Treasury yield curve is raising concern about the economy’s prospects. That’s to be expected, since the slope of the curve has gained in importance as a forecasting tool due to its consistent and reliable track record. In short, a narrow curve is associated with a slowdown in growth.
The economic signal is even stronger when there is an outright curve inversion, which is when short-term yields exceed those on longer-dated Treasuries. We’re not there yet, but what has everyone up in arms is that at 63 basis points, the difference between two- and 10-year Treasury yields has collapsed from 128 basis points in January and is now the narrowest since 2007, just before the start of the last recession.
For some, changes in the Treasury yield curve are sufficient to warrant a change in the view on the future path of the economy. Right now, though, it’s not. It is important to balance the changes taking place in the financial market’s yield curve with the economy’s yield curve.
The economy’s yield curve is the spread between the federal funds rate and nominal gross domestic product. This relationship is most important since it’s the ability of the consumer and businesses to carry or afford the higher borrowing costs that could eventually impact economic growth.
Based on third-quarter data, the economy’s yield curve is close to 300 basis points, which is calculated by taking the 4.1 percent annualized rate of growth in nominal GDP less the quarterly average for the federal funds rate of 1.15 percent. The gap has expanded by 65 basis points from a year earlier. Even if the Federal Reserve, as expected, raises rates by 25 basis points at its December meeting the spread should widen based on estimates of 4.5 percent to 5 percent growth in nominal GDP.
In a historical perspective, the economy’s yield curve is unusually wide, consistent with a positive growth outlook. To be sure, the average spread during the 1990s growth cycle was 100 basis points and in the 2000s it was 200 basis points. Moreover, history also shows that a flat or an inverted spread between the federal funds rate and the growth in nominal GDP always precede an economic slowdown or recession.
In contrast, the traditional financial market yield curve, or the spread between the federal funds rate and the 10-year Treasury, stood at 110 basis points in the third quarter. It will likely end 2017 with the narrowest quarterly spread since the start of the last recession, sending the same signal as the two- to 10-year part of the curve.
It is quite possible that the narrowing of the traditional yield curve reflects technical factors more so than fundamental ones. The quantitative bond buying programs by the Fed and other central banks have no doubt produced an anchoring effect at the long-end of the bond market that was not present in prior cycles.
Also, changes in monetary policy often influence investor expectations on the outlook for growth and inflation. Given the current low-inflation environment, it could well be investors are betting that current path of monetary policy will dampen future inflation risks and possibly to lead to a reversal in short rates at some point down the road.
In all likelihood, the signaling effect from changes in the yield curve to the economy may not be as robust today and limited to the financial markets. The economy, meanwhile, will be supported by the wide and positive spread between the federal funds rate and nominal GDP growth, helping to support corporate profits and equities. The outlook for the fixed-income market is less sanguine because the positive growth environment will compel the Fed to continue to normalize monetary policy by boosting rates further.

From: Bloomberg / Joseph Carson / 21 de noviembre


